
Passer rating is a statistic that leaves out a lot of crucial information. How does the NFL quarterback leaderboard change if we improve the stat?
A little over halfway through the 2020 season, I created a new-and-improved version of the classic “passer rating” statistic to rank all of the league’s qualified quarterbacks in a more accurate way. Now that the season has concluded, let’s circle back and see how everyone stacked up through 17 weeks.
First, let’s run through a refresher course on this brand new revised version of passer rating. We’ll refer to it as “RPR” (revised passer rating).
The basic passer rating statistic that is widely used in football media has a bevy of flaws. It does not account for extremely important aspects of quarterback play such as sacks, fumbles, rushing production, or first down pickups (either passing or rushing). It is also largely determined by completion percentage, a stat that tells you nothing about a quarterback’s productivity. A completion can go for -5 yards or 95 yards, so giving a quarterback credit for completing a pass without taking into account what that pass actually yielded does not make much sense.
So, I decided to create a metric that includes all of the easily-trackable box score statistics that are ignored by passer rating. RPR works off of the basic concept of passer rating while throwing in sacks, sack yards, fumbles, rushing attempts, rushing yards, rushing touchdowns, passing first downs, and rushing first downs to get a far more well-rounded look at a quarterback’s overall performance.
Like the original passer rating, RPR is based on four factors that are weighted equally. Each of them is an improvement over the original.
#1: Yards per play. Passer rating solely looks at yards per pass attempt, but RPR adds in sack yards, rushing yards, sacks, and rushing attempts, taking the complete yardage total and dividing it by the total number of plays (passes + rushes + sacks).
#2: Touchdown percentage. Passer rating solely looks at the percentage of pass attempts that result in touchdowns, while RPR tosses in rushing touchdowns and divides the overall touchdown total (passing + rushing) by the total number of plays.
#3: Interception/fumble percentage. Passer rating solely looks at the percentage of pass attempts that are intercepted, while RPR includes fumbles (all fumbles, not just lost fumbles) and divides the overall interception-plus-fumble total by the total number of plays.
#4: Conversion percentage. Looking for a way to reward consistency, passer rating includes completion percentage as a factor. However, completion percentage hardly tells us anything meaningful, for reasons we touched on earlier. RPR uses a better metric for evaluating consistency – conversion percentage. A quarterback’s combined total of passing and rushing conversions (first downs + touchdowns) is divided by the total number of plays. Instead of rewarding completions, which can be unproductive, we are tracking how consistently a quarterback makes a definitively positive play.
Let’s dive into the 2020 quarterback rankings according to our enhanced version of the old-school passer rating. Where do Sam Darnold and Joe Flacco stack up?
Yards per play
Here is a look at how the league’s 44 qualified quarterbacks (100+ dropbacks) stacked up in terms of yards per play.
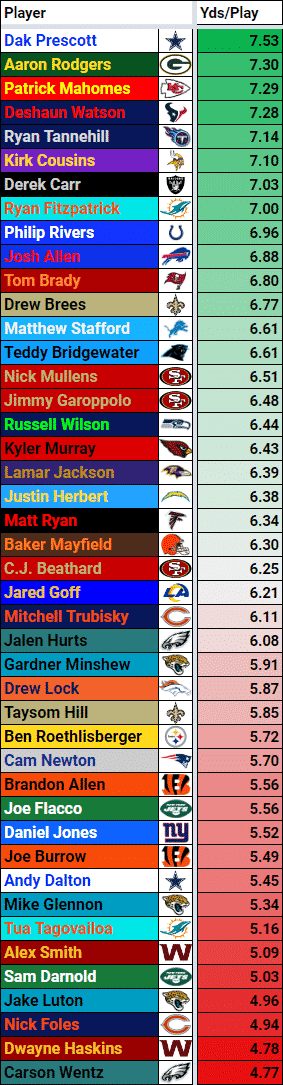
Darnold checks in at 40th with a mark of 5.03, surpassing only Jake Luton, Nick Foles, Dwayne Haskins and Carson Wentz. Flacco ranked a tad higher at 33rd with 5.56 yards per play.
He struggled on all three downs, but Darnold particularly had a rough time getting things going on first down, putting himself in tougher positions on second and third down. Darnold averaged only 4.82 yards per play on first down, second-worst among qualified quarterbacks, ahead of only Haskins (4.00).
Touchdown percentage
Here is how the 44 quarterbacks stacked up in terms of the percentage of their plays in which they recorded a passing or rushing touchdown.