
Run-blocking stats for New York Jets’ offensive linemen, tight ends, and wide receivers in 2022
I believe run-blocking is the most overlooked and under-analyzed aspect of football. It’s such an important piece of the sport, and yet, there are barely any statistics out in the world that quantify players’ individual run-blocking production.
It seems this is due to the simple fact that run-blocking is so much harder to see on television than other parts of the sport. When watching a game on the TV broadcast, it’s easy for any viewer to spot when a quarterback makes a great throw or a receiver drops a pass. But run plays look like nothing more than a chaotic, indiscernible mess in which a clump of humanity converges into a big pile. Run plays come and go throughout the game and nobody can really tell what happened on each of them, save for the rare replay.
A major reason for the anonymity of run-blocking is the angle of the broadcast. Since viewers are watching from parallel to the line of scrimmage rather than from the end-zone angle, it’s extremely hard to see what’s happening in the trenches.
With no readily available statistics and no spotlight on television, the only way to really know which blockers were responsible for the result of each run play is to go back and rewatch every play on film from the end-zone angle. Who deserves credit for throwing the blocks that led to a good run? Who deserves to be blamed for missing the blocks that caused a run to be stuffed?
I re-watched every run play from the New York Jets’ 2022 season to get these answers.
Let’s take a look at some run-blocking stats from the Jets’ offensive linemen, tight ends, and wide receivers in the 2022 season. I hope this data can be helpful as you map out your ideal plan for the Jets this offseason.
Explaining the run-blocking stats
My main goal was to find each blocker’s ratio between good plays and bad plays. This would give us a solid gauge of each player’s run-blocking consistency.
I rewatched every non-QB run by the Jets this season. If a run was successful, I gave credit to the blockers who contributed to making the run successful. On unsuccessful runs, I attributed blame to the blockers who contributed to the run’s failure.
This is my criteria for a successful run: Gains at least 40% of the required yardage on first down, gains at least 60% of the required yardage on second down, or picks up the conversion on third/fourth down.
If a run meets one of those criteria, it is a success, and I dole out positive credit to the blockers responsible. If a run does not meet one of those criteria, it is a failure, and I dole out negative credit to the blockers responsible.
I excluded rush attempts on impossible third-and-long plays.
How did I decide what constitutes a block that deserves positive credit for assisting a successful run? To me, a blocker deserved credit if they directly contributed to the creation of the lane used by the runner on their way to success. If I think a successful play likely would have failed if a particular player lost his block instead of winning it, that player deserves credit.
How did I decide what constitutes a block that deserves blame for causing an unsuccessful run? It’s pretty much the opposite of what I described for a positive run. If a player’s missed block directly contributes to preventing the runner from achieving a successful result, the blocker deserves to be blamed.
Multiple players could be charted on any positive or negative play. In fact, on the majority of runs, I charted more than one player. Run-blocking is a team effort, after all.
I tend to chart a greater total of players on the average successful play than on the average unsuccessful play. Specifically speaking, on successful plays, I credit about 3.0 players on average, while on unsuccessful plays, I blame about 1.5 players on average.
Why is this the case? Well, it usually takes a bunch of good blocks for a run to be successful. One or two bad blocks can ruin everything. So, if a play is successful, there are often a lot of players who deserve credit. Whereas, if a run is unsuccessful, it can often be blamed on one or two guys.
Examples
Let’s take a look at two plays to exemplify how everything works.
This is a 13-yard gain by Zonovan Knight on first-and-10. It is a successful run. I gave credit to Connor McGovern (#60), Nate Herbig (#65), George Fant (#76), and Garrett Wilson (#17) for throwing the key blocks that made this run possible.
This is a run for no gain by James Robinson on third-and-1. It is an unsuccessful run. I blamed Duane Brown (#71) and Connor McGovern (#60) as the culprits for this run’s failure.
Without further ado, let’s get into the numbers.
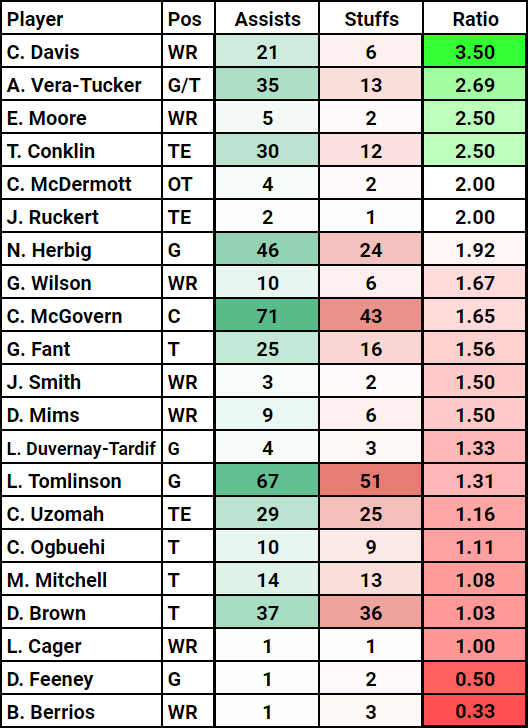
Here are my tallies for “Assists” and “Stuffs Allowed” for all Jets blockers from Weeks 1-17:
Get Started: Learn More About Becoming A Jet X Member
For reference, my educated guess is that the league average assist-to-stuff ratio would be somewhere around 2.0-to-1 if I did this study for the whole league. It is impossible to know for sure unless I actually did this for every team, but that seems to be a reasonable benchmark.
I based this on two things:
- The league average rushing success rate, using the criteria I laid out above, is approximately 50%. This means the average team is expected to have approximately the same number of successful runs and unsuccessful runs.
- On average, I tend to positively credit about 3.0 players per good play and negatively credit about 1.5 players per bad play.
So, if the average team has the same number of successful and unsuccessful runs, and each successful run yields 3.0 assist credits while each unsuccessful run yields 1.5 stuff credits, that translates to a ratio of 2.0-to-1.
Let’s discuss some of the main takeaways from the table above.
Takeaways
The majority of the team was subpar at run-blocking, save for a few exceptions
Going off the 2.0-to-1 benchmark, the vast majority of the Jets’ roster was below average when it comes to run-blocking. The only exceptions were Corey Davis (3.5-to-1), Alijah Vera-Tucker (2.7-to-1), and Tyler Conklin (2.5-to-1). Elijah Moore is also up there, although his sample is small.
Davis lives up to his billing as a great blocker. He contributed to an unusually large number of positive runs for a wide receiver, and rarely was the culprit for a bad run. His abilities as a blocker must be taken into account when the Jets are mulling whether to release him this offseason.
Vera-Tucker’s superstardom is proven by these numbers. Early in the season, most people agreed that he was single-handedly holding the Jets’ offensive line together, and these numbers back that up. AVT was the most efficient run-blocking offensive lineman on the team by a wide margin. In fact, he was the Jets’ only above-average run-blocking offensive lineman. It’s no wonder the Jets’ rushing attack faltered once he went out.
AVT’s splits between guard and tackle are interesting. At guard, I tallied him with 15 assists and 4 stuffs allowed, a stellar ratio of 3.75-to-1. At tackle, I had him with 20 assists and 9 stuffs allowed, a ratio of 2.22-to-1 that is still solid but definitely a sizable step back from his work at guard. This is the reverse of his pass-blocking numbers. Pro Football Focus charted Vera-Tucker with better pass-blocking production at tackle than guard.
Conklin blocked well this season. The same cannot be said for his fellow free-agent tight end (more on that later), but Conklin handled his business in the run game. He gets too much flack from Jets fans. Conklin is a good piece in this Jets offense as both a pass-catcher and blocker.
The main culprits are clear
The vast majority of the Jets’ run-blockers were below average this year, but three players jump off the screen as the biggest liabilities: Laken Tomlinson, Duane Brown, and C.J. Uzomah.
This list shows the cumulative run-blocking value of each player. It shows the difference between their actual assist-to-stuff margin and the margin they would be expected to have with a league-average ratio over the same sample of plays. In other words, this is an estimation of their total run-blocking impact rather than their run-blocking efficiency.
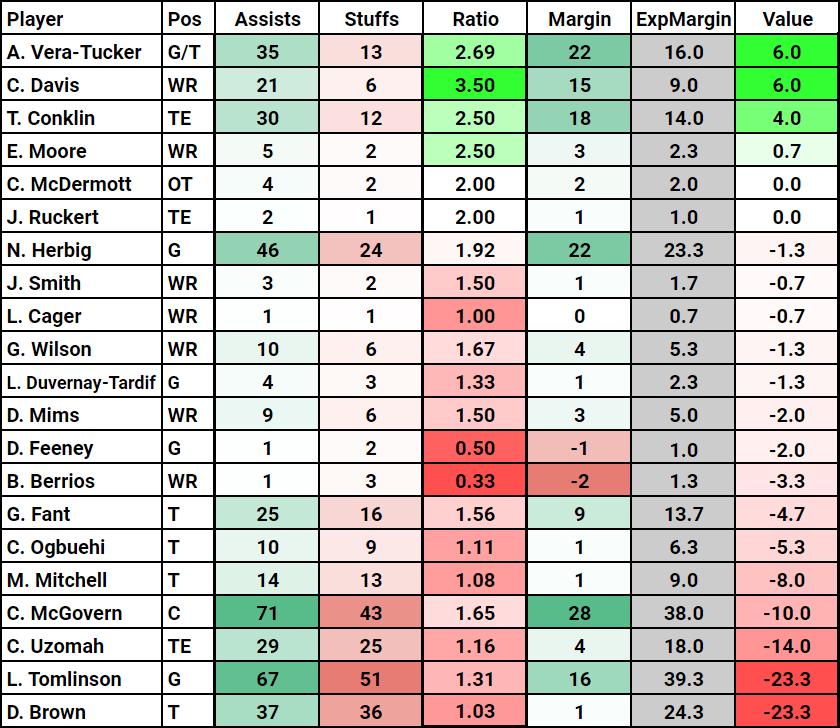
Quick explanation on how that works: Duane Brown has 37 assists and 36 stuffs. That’s 73 total plays. If he had a league-average 2.0-to-1 ratio over 73 plays, he would have 48.67 assists and 24.33 stuffs, which is a +24.3 margin. Brown’s actual margin is +1, meaning his margin falls 23.3 plays below expectation (1 – 24.3 = negative-23.3).
Brown and Tomlinson were major liabilities for the Jets’ run game, each posting a -23.3 margin versus expectation. Uzomah was third-worst at -14.0. That’s a -60.6 margin versus expectation between the three of them.
Combined, the Brown/Tomlinson/Uzomah trio should have been expected to get 163 assists and 82 stuffs over their playing time, but they actually combined for 133 assists and 112 stuffs allowed – 30 fewer assists than expected and 30 more stuffs allowed than expected.
That’s a lot of bad blocking for three guys who are each getting paid handsomely.
Brown (1.03-to-1) can be excused for his struggles since he is 37 years old and was dealing with a shoulder injury all season. Plus, he was a desperation pickup after Mekhi Becton’s injury. Still, it should be clear that Brown was very bad in the run game this year. He should not be viewed as a starting option going into next season.
Tomlinson (1.31-to-1) has looked like a massive disappointment all season and these numbers support it. Week after week, I saw Tomlinson allowing one run-stuff after another. He’s allowed a team-high total of 51 stuffs. That makes up 28% of the Jets’ unsuccessful runs. So, Tomlinson was responsible for over one-quarter of the Jets’ failed run plays.
Uzomah (1.16-to-1) is another player who provided abysmal run-blocking this year. It’s highly detrimental for an offense when your primary blocking tight end… well, can’t block. Uzomah looks especially poor in comparison to Conklin.
Other players who notably struggled include Connor McGovern (1.65-to-1), Cedric Ogbuehi (1.11-to-1), and Max Mitchell (1.08-to-1).
In a recent article I published, which focused only on the Jets’ post-bye week games, McGovern stood out as the best run-blocker on the team. After rewatching the entire year, I found out that McGovern was very poor prior to the bye week. The post-bye stretch was not a representation of his season as a whole. Overall, he was a negative in the run game this year. Couple that with his shoddy pass protection and it seems clear the Jets should not bring him back in free agency this year.
Mitchell and Ogbuehi struggled as much as you would expect a team’s Plans Y and Z tackle options to struggle. Both players were highly inefficient during their short stints in the lineup.
George Fant (1.56-to-1) also had a subpar season in the run game, although not as bad as Brown, Mitchell, or Ogbuehi. Considering his health woes this year, I could see Fant climbing back to a league-average level as a run-blocker in the future.
Nate Herbig (1.96-to-1) was about average in the run game.
Another way of looking at the numbers
I’m about to get very nitty-gritty into the data. Just a fair warning.
One flaw of this metric is that players are limited to the quality of their team. They can only be credited for assists on successful runs and can only be credited for stuffs on unsuccessful runs. So, if you are on a bad rushing team (such as the Jets and their 44.4% rushing success rate), then it means you have fewer opportunities to gain assists than the average player, and more opportunities to gain stuffs.
This would make it difficult to compare players on different teams. A player on the 49ers who is equally good at run-blocking as a player on the Jets would have a better assist-to-stuff ratio, since his team produces a much greater percentage of successful runs.
Good players on bad teams are the main victim of this. Take Vera-Tucker, for example. His 2.7-to-1 ratio is good, but compared to a league-average of 2.0-to-1, it might not seem all that great.
To get a better view of how Vera-Tucker (and all Jets blockers) might fare if he were on an average team, I came up with an adjusted ratio. It compares the percentage of their team’s successful runs that they assisted to the percentage of their team’s unsuccessful runs that they were blamed for. This way, players are not limited by the overall rushing success rate of their team.
Here are the “true” ratios of the Jets’ players – in other words, how their ratio would look after adjusting for the fact that the Jets are a bad rushing team overall. (Remember, 2.0-to-1 is still considered league-average here.)
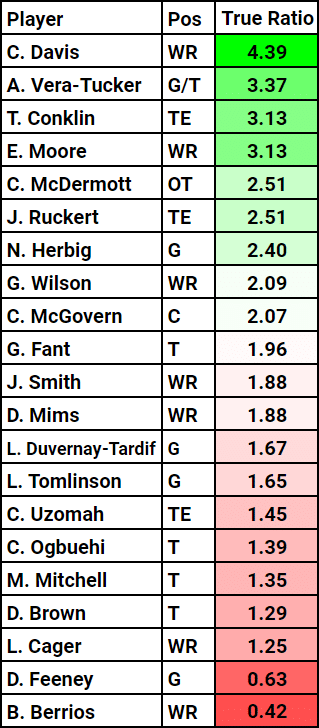
This list emphasizes the elite status of Vera-Tucker. On film, there are a lot of instances where Vera-Tucker makes a great block but doesn’t get assist credit since someone else on the team blows their block and causes the play to be unsuccessful. This metric accounts for that. After adjusting for the fact that Vera-Tucker plays on a bad team that limits his assist potential, his ratio rises to 3.37-to-1, which would likely be one of the NFL’s best numbers. It’s 68.5% better than my estimated league average. That’s darn good. (His “true” ratio at guard was 4.70-to-1, compared to 2.79-to-1 at tackle.)
It also makes Herbig look slightly above average while McGovern and Fant creep to around the league-average mark. Tomlinson, Uzomah, and Brown remain in the cellar.
The bottom line
Alright, I’ll admit it – my analytical brain kind of went off the rails a little bit in the latter portion of this article, getting quite deep into the numbers. I love that stuff, but I get it’s not for everybody.
Simply put, here is one last look at the numbers you came for – assists, stuffs allowed, and the ratio between them.