Where did the New York Jets offensive line rank in 2021?
Opinions on the 2021 New York Jets offensive line are all over the place. Some fans think the unit was a complete monstrosity that gave Zach Wilson no chance to succeed and still needs a major overhaul. Others think the unit was quietly solid and is only one or two pieces away from reaching elite status. Most people fall somewhere in the middle.
To help us get a better grasp of where this unit stands as we head into the 2022 offseason, I decided to do a deep dive into the numbers and concoct the best possible estimation of how the group performed in 2021.
I stacked up all 32 teams in five different offensive line statistics and then brought those numbers together to get a cumulative ranking of every offensive line in the NFL.
Let’s hop into it. We’ll begin by taking a look at the Jets’ rankings in each category before combining everything into a one-number overall score at the end of the piece, giving us a consummate ranking.
Run blocking
I analyzed three different statistics to rank each offensive line’s run blocking ability:
- Pro Football Focus run-blocking grade: PFF’s one-number estimation of the quality of a player’s run-blocking based on the grading of every snap.
- Yards before contact per carry by RBs: Average yards gained before contact on rush attempts by running backs. (via PFF)
- Adjusted line yards per carry: Via Football Outsiders, this statistic estimates how much of a team’s rushing yardage was produced by the offensive line. It also adjusts rushing yardage based on down, distance, situation, opponent, and the difference in rushing average between shotgun compared to standard formations.
PFF run-blocking grade
To calculate this statistic for each unit, I took every offensive lineman’s PFF run-blocking grade and weighted it based on how many run-blocking snaps they played. I then combined the scores of every offensive lineman on each team to get 32 cumulative scores.
The Jets’ offensive linemen combined for a solid PFF run-blocking grade of 71.2, which ranked 14th in the NFL. The league average was 67.5.
Yards before contact per carry
This is a team-wide statistic rather than an accumulation of the individual statistics posted by offensive linemen, so the skill position players (TE/WR/RB) do have a minor impact on it, but the offensive line is still mostly responsible for this number.
New York’s running backs averaged only 1.10 yards before contact per carry, which ranked 26th in the league. The NFL average was 1.31.
It’s worth noting that the Jets finished strong in this category after inserting Laurent Duvernay-Tardif into the lineup at right guard. From Weeks 11-18, the Jets averaged 1.41 yards before contact per carry. For reference, that would have ranked 12th in the league over the whole season.
Adjusted line yards per carry
Like the previous stat, adjusted line yards per carry (ALYPC) is a team-wide metric, so the offensive line is not solely responsible for it, but it does have the most impact on this number by a wide margin. It tends to correlate closely with PFF’s run-blocking grade, validating its worth.
The Jets were one of the very few teams in the league whose offensive-line run-blocking grade did not correlate with their ALYPC. New York ranked 22nd with 4.06 ALYPC. The league average was 4.27.
Play: 👉 the Jet X Offseason Simulator

Pass blocking
I analyzed two different statistics to rank each offensive line’s pass blocking ability:
- Pro Football Focus pass-blocking grade: PFF’s one-number estimation of the quality of a player’s pass-blocking based on the grading of every snap.
- Time-adjusted pressure rate: Percentage of pass-blocking snaps in which a player allowed pressure, adjusted for his team’s average time-to-throw. (Via PFF)
PFF pass-blocking grade
Just like run-blocking grade, a team’s average in this category was calculated by weighting every player’s pass-blocking grade according to their playing time (pass-blocking snaps) and then combining the performance of every player on each unit.
The Jets were mediocre in this category. Their offensive linemen combined for a 63.1 pass-blocking grade, ranking 20th. The league average was 64.4.
Time-adjusted pressure rate
Pressure rate is a simple statistic that I use often. The gist of the metric is straightforward: on what percentage of a player’s pass-blocking snaps did he allow pressure? It’s very basic to calculate (pressures allowed ÷ pass-blocking snaps).
This stat can easily be combined amongst all players within a unit to get a cumulative result. All you need to do is combine the pressures-allowed and pass-blocking-snap totals for every offensive lineman on the team.
The Jets’ offensive linemen combined to allow 201 pressures on 3,616 pass-blocking snaps, which is a pressure rate of 5.56% that ranked 25th in the league. The NFL average was 4.90%.
While pressure rate is a solid metric on its own, I decided to take things one step further in an effort to improve the accuracy of the statistic.
The difficulty of an offensive lineman’s job in pass protection is greatly affected by the style of play utilized by his quarterback and his offensive scheme. Pressure rate does not account for those things. For the purpose of this study, I wanted to make sure we looked at the whole picture.
Anybody can rack up snaps without allowing pressure if their quarterback is always getting the ball out immediately. The Steelers, for instance, averaged only 2.28 seconds per dropback, the fastest average in the league. It would be unfair to compare their offensive linemen on the same plane as the linemen of the Jets, who had a much tougher job as their team averaged the fifth-highest time-per-dropback at 2.88 seconds.
I compared each team’s average time per dropback against the NFL average (2.73 seconds) and adjusted the raw pressure rates of that team’s offensive linemen accordingly*.
*Formula: ( (2.73 ÷ Team’s time-per-dropback) x Team’s raw pressure rate)
The league average of 2.73 seconds is 94.8% of the Jets’ 2.88 seconds, so to get the Jets’ adjusted pressure rate, you just take 94.8% of their raw pressure rate.
The raw pressure rate allowed by the Jets’ offensive linemen was 5.56%, ranking 25th. But when you apply the time-to-throw adjustment and take 94.8% of that 5.56% mark, the number drops to 5.27%, which ranked 20th among the adjusted pressure rates of all 32 teams.
So, the Jets’ offensive line looks significantly more competent when you account for how long their quarterbacks held the ball. Zach Wilson was the particular culprit for that number, averaging 3.05 seconds. Mike White (2.52) and Joe Flacco (2.30) spent much less time with the ball in their hands.
This adjustment gives us a much better estimation of pass-blocking quality. The correlation coefficient (r=) between PFF’s pass-blocking grade and raw pressure rate was -0.7578, whereas the correlation coefficient between PFF’s pass-blocking grade time-adjusted pressure rate was -0.8506 (for reference, a perfect correlation is 1.0).
Okay, if you’re still with me, I apologize for going down a rabbit hole there. Here’s your TL;DR: the Jets’ offensive linemen ranked 20th in allowed-pressure frequency when adjusting for how much time they had to spend blocking.
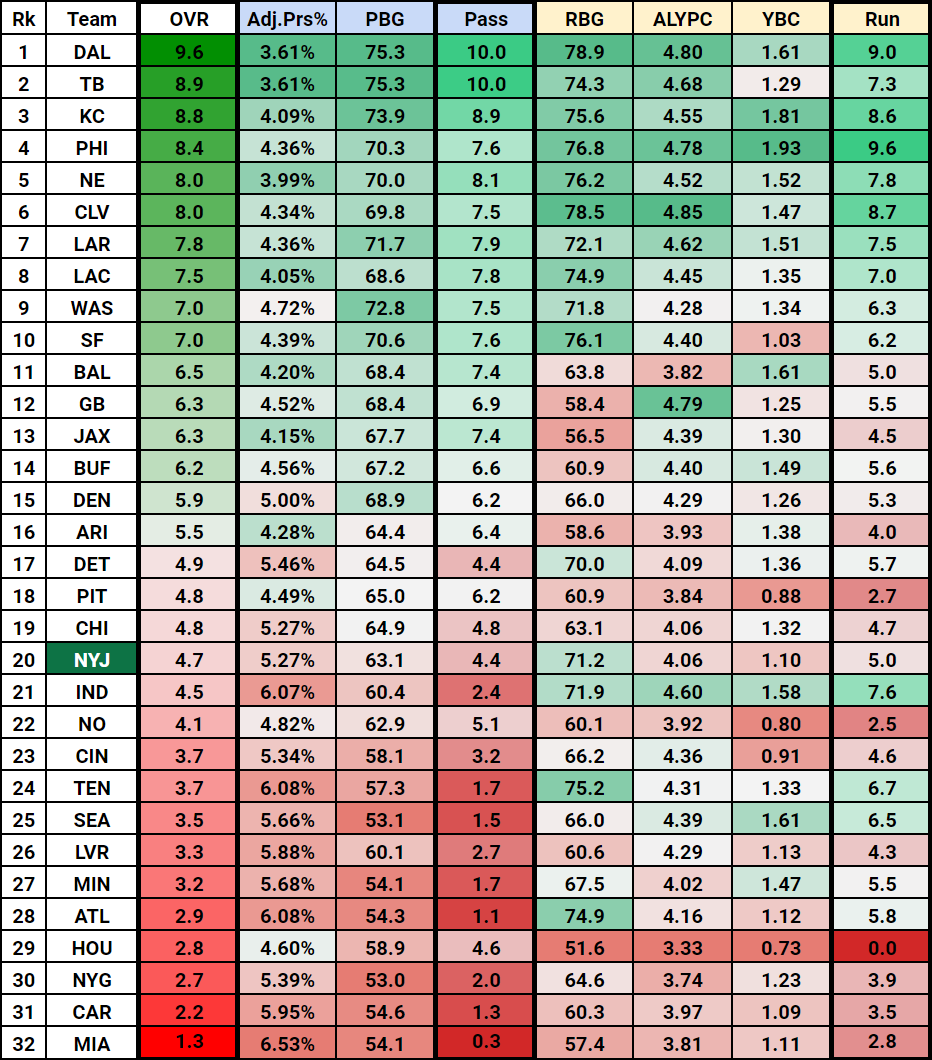
Overall rankings
Now that we’ve seen where the Jets ranked in five key offensive line categories, let’s see where they rank overall when we bring those five metrics together.
Each team received a 0-to-10 score for their performance in each metric. The worst team in a metric received a 0, the best team received a 10, and the other 30 teams were scored based on how they performed relative to those two points. A score of 5.0 represents the midpoint between the league’s worst and best teams in a metric.
This method prioritizes how a team performed versus average instead of what their ranking was.
I averaged together the three run-blocking statistics to get a run-blocking score and then averaged together the two pass-blocking statistics to get a pass-blocking score.
The final leaderboard was stacked up through an overall score that was arrived upon by combining each team’s run-blocking score and pass-blocking score.
Since offensive linemen in the 2021 season had a 61.2%/38.8% ratio of pass-blocking snaps to run-blocking snaps, the pass-blocking score was worth 61.2% of the overall score while the run-blocking score was worth 38.8%. It makes sense to place a greater premium on pass-blocking considering how much more common it is than run-blocking.
Alright, let’s take a look at how the Jets fared. We’ll start with the run game:
- PFF run-blocking grade: 71.2 – Rank: 14th – Score: 7.18
- Yards before contact: 1.10 – Rank: 26th – Score: 3.10
- Adjusted line yards: 4.06 – Rank: 22nd – Score: 4.82
Combine those three scores together and you get the Jets’ run-blocking score of 5.03, which ranked 20th in the NFL.
Here’s how the Jets did in the passing game:
- PFF pass-blocking grade: 63.1 – Rank: 20th – Score: 4.55
- Time-adjusted pressure rate:: 5.27% – Rank: 20th – Score: 4.31
Combine those two scores and you get the Jets’ pass-blocking score of 4.43, which ranked 21st.
Blend New York’s pass-blocking and run-blocking scores, and the Jets check in with an overall score of 4.66, which makes them the 20th-best offensive line in the NFL.
There you have it. A ranking of 20th overall seems to be the best estimation for how well the Jets’ offensive line played in 2021. While the unit was not good, it certainly wasn’t terrible, either. “Slightly below average” is an accurate label.
Seen below is the overall NFL leaderboard. If you want to see a more detailed table that includes the scores accompanied with each metric, click here.