We charted run-blocking stats for the New York Jets offensive line over their putrid rushing stretch
The New York Jets‘ rushing attack was one of the primary reasons behind their surprising 6-3 start.
From Weeks 5 through 9 – a stretch in which they compiled a 4-1 record with a +45 point differential – the Jets ranked 10th in rushing yards per game (138.8), 10th in yards per rush attempt (5.0), and first in rushing touchdowns (9). New York had a top-10 run game that was capable of bailing out its lackluster passing attack. It was the perfect complement to an elite defense.
The Jets have not looked like the same football team since coming out of their Week 10 bye, posting a 1-5 record. This fall-off can be largely attributed to the massive regression of New York’s run game.
Since Week 11, the Jets are 28th in rushing yards per game (88.2), 28th in yards per rush attempt (3.7), and 20th in rushing touchdowns (3).
Obviously, the Jets’ offensive line deserves a lot of blame for the team’s putrid rushing numbers in recent weeks. But who on that offensive line deserves the most blame?
I was curious to find out which individual blockers have been the biggest culprits behind New York’s nonexistent run game. So, I studied the film and charted some of my own run-blocking statistics.
Explaining the run-blocking stats
My main goal was to find each blocker’s ratio between good plays and bad plays. This would give us a solid gauge of each player’s run-blocking consistency.
I rewatched every non-QB run by the Jets over their past six games. On successful runs, I gave credit to the blockers who contributed to making the run successful. On unsuccessful runs, I attributed blame to the blockers who contributed to the run’s failure.
This is my criteria for a successful run: Gains at least 40% of the required yardage on first down, gains at least 60% of the required yardage on second down, or picks up the conversion on third/fourth down.
If a run meets one of those criteria, it is a success, and I dole out positive credit to the blockers responsible. If a run does not meet one of those criteria, it is a failure, and I dole out negative credit to the blockers responsible.
I excluded rush attempts on impossible third-and-long plays.
How did I decide what constitutes a block that deserves positive credit for assisting a successful run? To me, a blocker deserved credit if they directly contributed to the creation of the lane used by the runner on their way to success. If I think a successful play likely would have failed if a particular player lost his block instead of winning it, then that player deserves credit.
How did I decide what constitutes a block that deserves blame for causing an unsuccessful run? It’s pretty much the opposite of what I described for a positive run. If a player’s missed block directly contributes to preventing the runner from achieving a successful result, the blocker deserves to be blamed.
Multiple players could be charted on any positive or negative play. In fact, on the vast majority of runs, I charted more than one player. Run-blocking is a team effort, after all.
I tend to chart a greater total of players on the average successful play than on the average unsuccessful play. In other words, on successful plays, I tend to credit about 2.8 players on average, while on unsuccessful plays, I tend to blame about 1.6 players on average.
Why? Well, it usually takes a bunch of good blocks for a run to be successful. One or two bad blocks can ruin everything. So, if a play is successful, there are often a lot of players who deserve credit. Whereas, if a run is unsuccessful, it can often be blamed on one or two guys.
Let’s take a look at two plays to exemplify how everything works.
This is a 13-yard gain by Zonovan Knight on first-and-10. It is a successful run. I gave credit to Connor McGovern (#60), Nate Herbig (#65), George Fant (#76), and Garrett Wilson (#17) for throwing the key blocks that made this run possible.
This is a 2-yard loss by James Robinson on second-and-10. It is an unsuccessful run. I blamed Denzel Mims (#11), Duane Brown (#71), and Laken Tomlinson (#78) as the culprits for this run’s failure.
Without further ado, let’s get into the numbers.
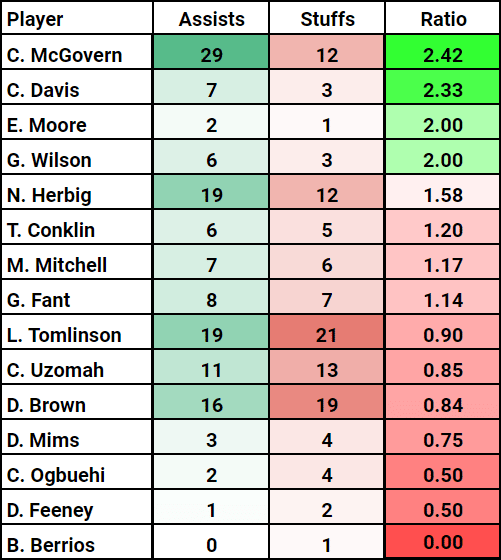
Here are my tallies for “Assists” and “Stuffs Allowed” for all Jets blockers from Weeks 11-16:
Get Started: Learn More About Becoming A Jet X Member
Without doing this study for the entire league, it is impossible to know what the exact NFL-average ratio of assists-to-stuffs would be. However, my educated guess is that the league average would be somewhere around 1.75-to-1.
I based this on two things:
- The league average rushing success rate, using the criteria I laid out above, is approximately 50-50.
- On average, I tend to positively credit about 2.8 players per good play and negatively credit about 1.6 players per bad play.
- So, if the average team has the same number of successful and unsuccessful runs, and each successful run yields 2.8 assist credits while each unsuccessful run yields 1.6 stuff credits, that translates to a ratio of 1.75-to-1.
So, if we go off that number, the Jets only have one offensive lineman who has been an above-average run-blocker over the past six games: center Connor McGovern, who has a 2.42-to-1 ratio. McGovern leads the Jets with 29 assists (10 more than any other player) while allowing only 12 stuffs.
All other Jets offensive linemen have been below-average. Nate Herbig comes the closest to average with his 1.58 mark. But once you get past Herbig, everyone has been abysmal.
These numbers support the eye test for Laken Tomlinson. He is exactly as detrimental as it seems. Tomlinson leads the Jets with 21 stuffs allowed over the past six games. From a volume perspective, he is the No. 1 culprit for the Jets’ rushing woes since the bye week.
However, there are two mainstay blockers who are struggling slightly more than Tomlinson from a consistency perspective: tight end C.J. Uzomah and left tackle Duane Brown.
Uzomah is coughing up far too many stuffs for a tight end who does not contribute much as a receiver. Brown’s struggles have been flying under the radar amongst Jets fans. He is arguably the team’s least consistent run-blocker among players who are routinely on the field.
The Jets could also use better consistency from Uzomah’s fellow tight end, Tyler Conklin, although Conklin has not been as bad as Uzomah in recent weeks.
On the positive side, give credit to Corey Davis and Garrett Wilson for their blocking contributions from the wide receiver position. I am not surprised to see Davis faring well on this chart, but Wilson’s work as a blocker caught me by surprise as I conducted this study. He is a better blocker than given credit for – recently, at least.
Ultimately, the data I collected proves that the Jets’ run-blocking woes are very much a team-wide issue. Other than McGovern, every offensive lineman on the team is struggling in the run game. The tight ends also need to be better, specifically Uzomah.
I’m looking forward to going back through the rest of the season at some point in the near future, charting both the Jets’ first nine games of the season and the two (possibly more?) that are still to come.
How good was Alijah Vera-Tucker when healthy? Did any of the players who are struggling post-bye look better during the pre-bye stretch? And finally, will anybody manage to put together an improved finish to the season? These are some exciting questions to answer. Stay tuned for the next run-blocking breakdown, likely to come at some point soon after the season’s conclusion.