Figuring out where the New York Jets’ safety unit actually ranked in 2022
The New York Jets‘ safety unit was the subject of immense criticism throughout the 2022 season. Here in the 2023 offseason, it has been frequently pegged as the Jets’ most dire need on defense.
Were the struggles of the Jets’ safeties overexaggerated? After all, they were the backbone of an elite pass defense that allowed the second-lowest opposing passer rating in the NFL.
Or was the Jets’ safety unit truly as bad as many people claim?
Read More Jet X Content:
Article: Was Jets OC Mike LaFleur actually good at things he can control?
Article: Safety was the NY Jets’ biggest defensive weakness in 2022
Article: The hidden truths behind NY Jets’ 2022 run defense
To figure out whether the harsh criticism of the Jets’ safety unit is fair, I decided to go back and rank all 32 safety units from the 2022 regular season based on their performance in a few different statistics. This will give us a clear visualization of exactly how well the Jets’ safeties played in 2022, helping us to get a better idea of how the Jets should approach the position this offseason.
I chose five different metrics for evaluating safety play and ranked all 32 safety units in each of them. I then ranked all 32 safety units based on their average ranking across the five categories.
Here are the five metrics I chose:
- Missed tackle rate
- Yards per target allowed
- Stop rate
- Touchdown/interception margin
- Snaps per penalty
All stats are via Pro Football Focus.
Without further ado, let’s dive in. It’s time to quantify the production of the Jets’ 2022 safety unit.
Missed tackle rate
Formula: Missed Tackles / (Missed Tackles + Tackles)
- Jets safeties: 15.5% (30th)
- League average for safeties: 11.6%
Missed tackles were a big issue for the Jets’ safeties. Both Jordan Whitehead (15.6%) and Lamarcus Joyner (14.5%) whiffed on tackle attempts far more frequently than the average NFL safety. Will Parks (22.2%) also struggled mightily at finishing tackles over his limited time on the field.
Yards per target allowed
Formula: Yards Allowed / Targets
- Jets safeties: 9.4 (31st)
- League average for safeties: 7.9
Opponents enjoyed plenty of success when challenging the Jets’ safeties, generating 9.41 yards per target. Joyner was the worst offender as he allowed 299 yards on 28 targets (10.7). Whitehead was also below average, allowing 283 yards on 34 targets (8.3).
Stop rate
Formula: Defensive Stops / Defensive Snaps
- Jets safeties: 1.92% (16th)
- League average for safeties: 2.01%
Pro Football Focus tracks a metric called “defensive stops”, which they define as “tackles that constitute a ‘failure’ for the offense”. These are typically tackles that go for short gains on first or second down or a tackle short of the sticks on third/fourth down.
The Jets were a smidgen below the league average in this category but still landed at 16th. Whitehead led the way, racking up 30 stops on a solid 2.66% rate, although his knack for stops was largely due to an extremely aggressive mentality that resulted in more bad than good.
Joyner only had 8 stops on 872 snaps for a 0.92% rate. It’s naturally more difficult for Joyner to collect stops due to his role as a free safety who rarely plays in the box. However, Tony Adams took Joyner’s role over the final two games of the season and he managed to get 3 stops on only 104 snaps (2.88%), flashing potential as a playmaking free safety in a very tiny sample size.
Touchdown/interception margin
Formula: Touchdowns – Interceptions
- Jets safeties: 0 (8th)
- League average for safety units: +1.5
The Jets’ safeties were credited with allowing 6 touchdowns but they balanced it out with 6 interceptions, giving them an even margin that tied for eighth-best. The average safety unit allowed 6.9 touchdowns and recorded 5.4 interceptions, a margin of +1.5.
Half of those six interceptions came in one game against the Pittsburgh Steelers, when Joyner snagged two and Whitehead grabbed one. It’s worth noting that one of Joyner’s two picks came on a Hail Mary at the end of the game.
Ashtyn Davis contributed an interception in Week 2, sealing the Jets’ comeback win over Cleveland.
Whitehead allowed four of the six touchdowns. Joyner allowed the other two.
Snaps per penalty
Formula: Defensive Snaps / Defensive Penalties
- Jets safeties: 390.3 (25th)
- League average for safety units: 528.1
Tagged with 6 penalties over 2,342 defensive snaps, the Jets’ safety unit was the eighth-most prone to penalties, getting flagged once every 390.3 snaps.
If they committed penalties at the league-average rate over the same number of snaps, the Jets’ safeties would have committed a total of 4.4 penalties.
Final rankings
Here is how all 32 safety units stack up when sorted according to their average ranking across the five aforementioned categories:
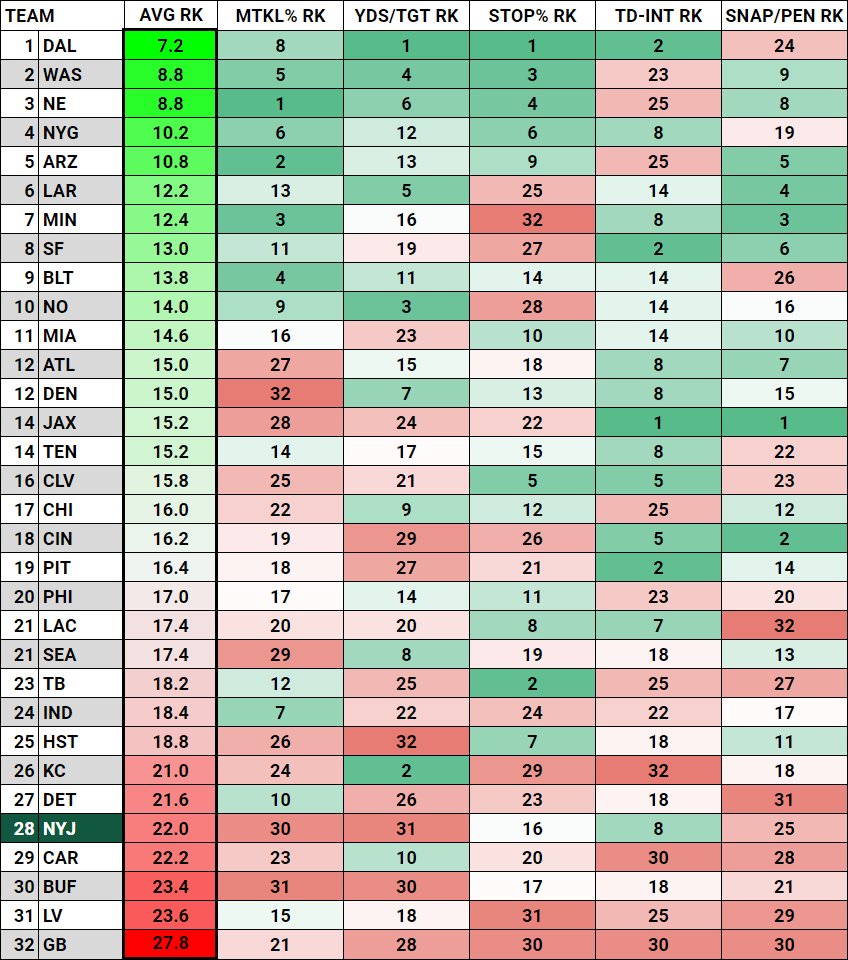
The Jets finished with an average ranking of 22.0 across the five categories, which placed 28th out of 32 safety units.
It appears the answer to the question posed in the title of this article is yes. The Jets’ safety unit truly was a major liability in 2022.