Michael Nania brings together a multitude of metrics to rank all 32 safety groups in 2019. Where did the Jamal Adams and Marcus Maye tandem rank?
Back in March, I conducted a study that blended a bevy of different metrics to get a solid estimate of exactly where the New York Jets offensive line ranked amongst the league’s 32 units in 2019.
I decided to apply that concept to the rest of the game’s positions. Today, we look at safety. Many believe that Jamal Adams and Marcus Maye form the best safety duo in football. Is that notion correct?
The method behind the rankings is simple – for each statistic, every team is scored on a scale of 0-to-10. The worst team receives a 0, the best team receives a 10, and the other 30 teams are scored relative to those two points. The final rankings are assembled according to each team’s average score across all statistics.
Previous rankings can be found here:
Let’s dig into the metrics behind the 2019 safety rankings.
Passer rating allowed
Statistics are the combined totals of all safeties to play for each team in 2019. These numbers are evaluating the 2019 regular season only and do not account for any moves made since the season’s conclusion.
These numbers do include the production of all safeties to play for each team – not just the top two or three – but in the Jets’ case, Adams and Maye are responsible for almost all of the production. They accounted for 2,048 of the team’s 2,098 safety snaps (97.6%). Bennett Jackson (27 snaps), Rontez Miles (19), and Matthias Farley (4) make up the other 50 (2.4%). Darryl Roberts did play a little bit at safety late in the year, but he rotated between there and cornerback so his production would be difficult to split.
We kick things off with a look at the passing game. Here is how the league’s safety groups stacked up according to passer rating allowed in coverage.
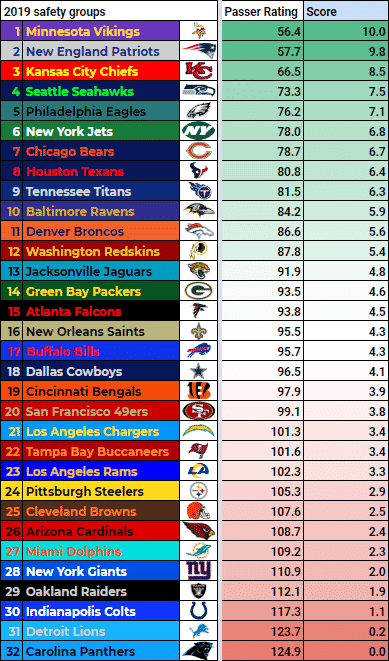 The Jets ranked sixth-best with a 78.0 passer rating allowed. Both Maye (76.0) and Adams (79.1) fared very well.
Yards per cover snap
Yards per cover snap measures the average amount of passing yards that a player yields per snap in coverage (yards allowed divided by cover snaps). I combined the totals of allowed receiving yards and coverage snaps played for each safety group to get a cumulative average.
This stat does a nice job of combining both a player’s ability to prevent targets in his direction and his ability to limit production on the passes that are thrown his way.
Here is how the league’s linebacker groups stacked up according to yards allowed per snap in coverage.
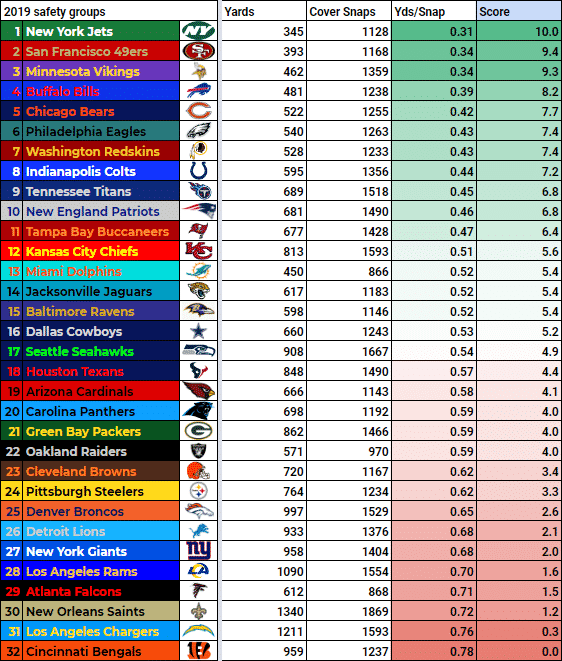
The Jets safety group led the NFL with only 0.31 yards allowed per snap in coverage. Maye (0.30) and Adams (0.31) each registered a mark better than that of any other safety group in the league.
PFF Coverage Grade
Pro Football Focus grades the performance of all defensive players on each and every snap, sorting those grades into the different facets of the game (coverage, run, pass-rush). I weighted each safety’s coverage grade by playing time (coverage snaps) to get an aggregate grade for each group. Here is how the league stacked up.
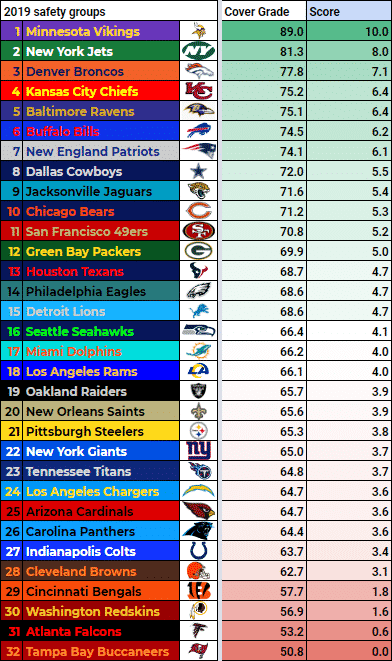
The Jets ranked second-best, trailing only the Vikings, whose tandem of Anthony Harris and Harrison Smith blew every other team out of the water.
Out of 70 qualified safeties, Adams posted the seventh-best coverage grade (87.3), while Maye recorded the 19th-best (79.3).
Passing game tackling efficiency
Our final category in the coverage department is tackling efficiency against the pass. It’s quite simple – missed tackles divided by total tackles plus missed tackles, with only passing game snaps included.
Here is how the league stacked up according to missed tackle rate in the passing game.

The Jets ranked 14th with a miss rate of 10.7% in the passing game, only slightly better than the positional average of 11.2%. Adams did solidly with a 7.9% miss rate (35 made, 3 missed) that landed him at the 74th percentile among safeties. Maye struggled in this department, landing at the 23rd percentile as he missed on 14.7% of his opportunities (34 made, 5 missed).
Run game tackling efficiency
We transition to the run game, kicking off with tackling efficiency.
Here is how the league stacked up according to missed tackle rate in the run game.
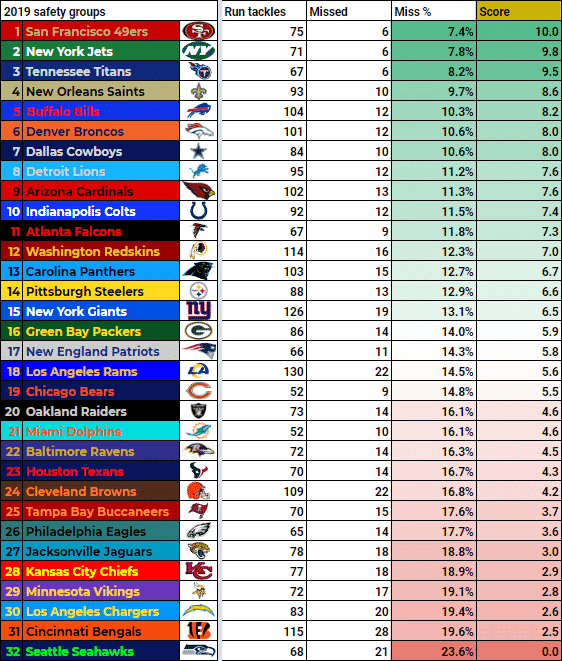
The Jets did a phenomenal job in this department. Adams missed only one tackle in the run game while converting 35 tackles, giving him a 2.7% miss rate that ranked second-best at the position. Maye did nicely with a 12.5% rate (35 made, 5 missed) that ranked at the 58th percentile.
Run stop percentage
A “run stop” is considered any tackle against the run that warrants a negative value result for the offense. For example, a stop for a gain of two yards on 3rd & 1 would not be a run stop, but a stop for two yards on 3rd & 3 would be.
I combined the totals of run stops and run defense snaps played for each safety group to get a cumulative rate. Here is how the league stacked up.
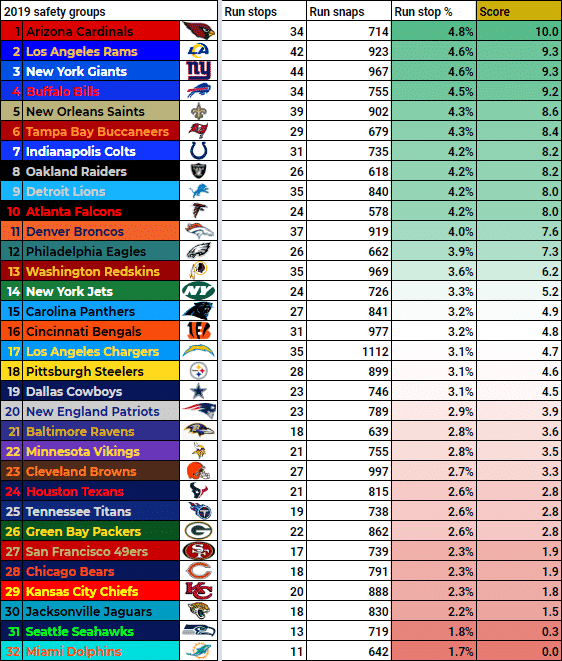
The Jets ranked 14th with a 3.3% rate that was dead-even with the positional average. Adams was active against the run with a 5.1% run stop rate that placed at the 81st percentile. He had 17 stops (10th-most) on 331 snaps (27th). Maye’s 1.9% rate ranked at the 33rd percentile, but that ranking is actually somewhat impressive when you consider how far off the ball he usually lines up. He picked up seven stops (45th) on 377 snaps (18th).
PFF Run Defense Grade
Pro Football Focus grades every defensive player’s performance against the run. I weighted each safety’s run defense grade by playing time (run defense snaps) to get an aggregate grade for each group. Here is how the league stacked up.
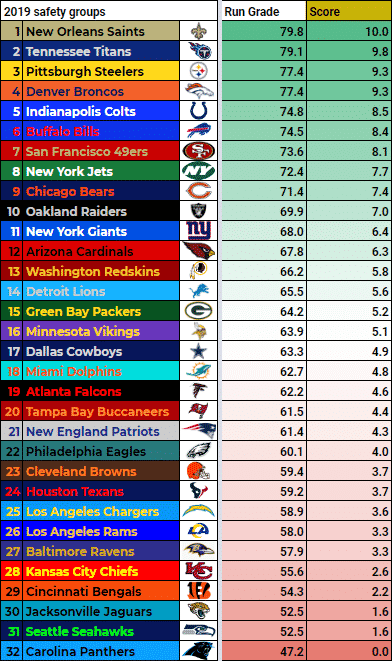
The Jets ranked eighth-best with an aggregate run defense grade of 72.4. Out of 70 qualifiers, Adams’ 78.3 grade ranked 11th-best while Maye’s 67.7 grade ranked 26th.
Pressure rate
We move to the third and final facet of the safety position – pass-rushing. Of course, each team varies in how often they like to blitz their defensive backs. We’ll account for the disparity in rush opportunities later on.
For now, we continue ranking teams by efficiency, starting with pressure rate (total pressures divided by rush snaps). Here is how the league stacked up.

In 2018, Adams tied with Derwin James for the most pressures among safeties, matching the single-season positional record of 18 (since it was first tracked in 2006). Adams clobbered that record in 2019 with a position-leading 23 pressures, those coming on 90 rush opportunities (25.6% rate).
Maye did not register a pressure on any of his four blitzes, while Miles did not get home on his one chance.
PFF Pass Rush Grade
Here is how the league’s safety groups stacked up according to Pro Football Focus’ pass-rushing grade.
Adams is in a class of his own when it comes to getting after the quarterback. His pass rush grade of 89.9 was the best among safeties with at least 20 rush opportunities, a full 6.0 points better than second-ranked Jabrill Peppers (83.9). Although Maye posted a brutal 40.0 grade in this department, it barely affected the Jets’ score since he only rushed four times.
The complete and final ranking
We’ve made it. Combining all nine of the metrics shown above, we get a fairly solid ranking of all 32 safety groups in 2019.
A team’s final score is calculated through a weighted combination of its coverage, run, and rush scores. Each of those three scores is simply the average score of all statistics in that facet:
- Coverage: Passer rating, yards per cover snap, pass game tackling efficiency, PFF Coverage Grade
- Run defense: Run game tackling efficiency, run stop percentage, PFF Run Defense Grade
- Rush: Pressure rate, PFF Pass Rush Grade
Those three scores are valued according to the distribution of each safety group’s snap count. For example, the Jets’ safety group played 57.9% of its snaps in coverage, 37.2% against the run, and 4.9% rushing the quarterback. Each phase is weighted accordingly to get the final score.
The moment you have been waiting for. Is Adams/Maye the best safety tandem in the NFL?