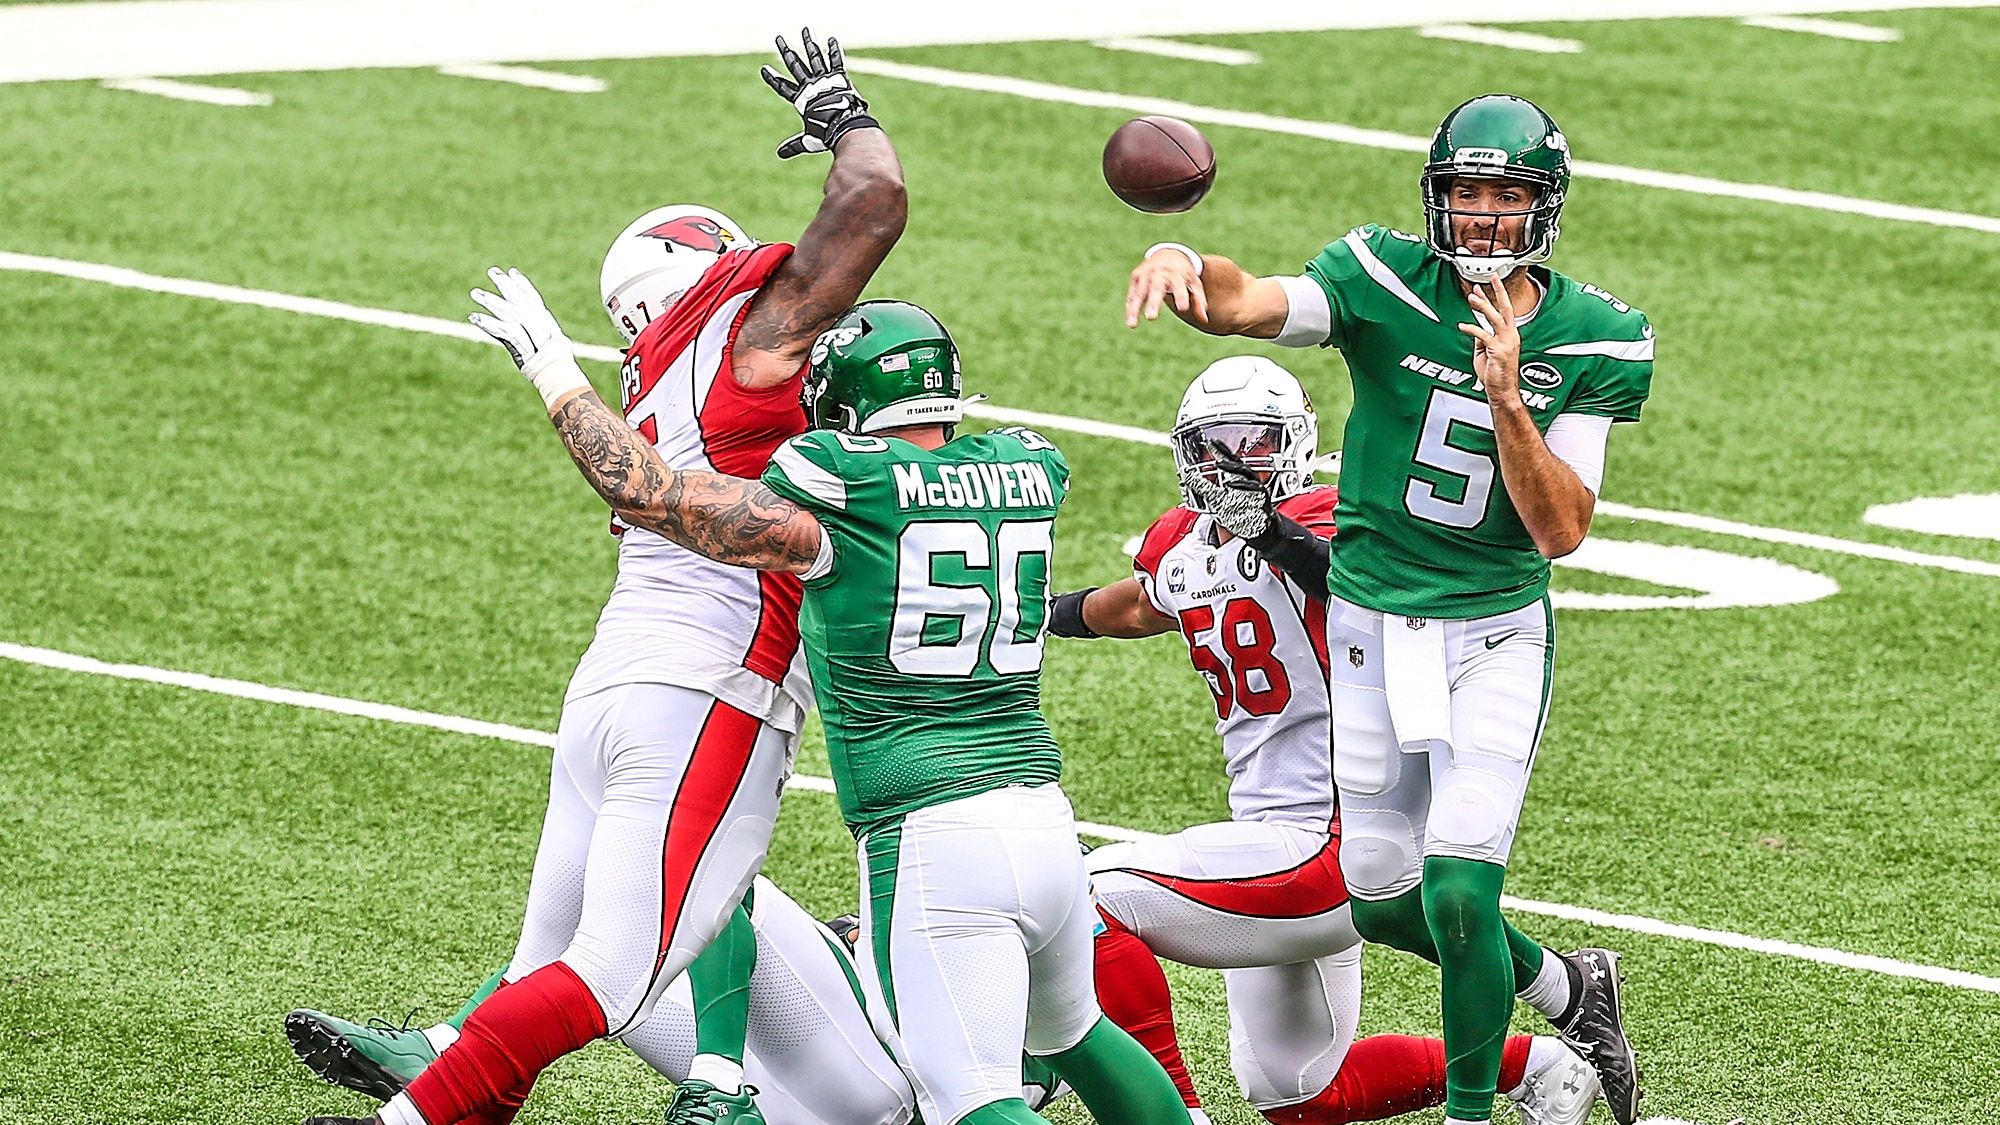
Michael Nania grades every throw from Joe Flacco‘s performance against the Arizona Cardinals. How well did he really play?
Each week this season, I will be grading every Sam Darnold play from the Jets’ most recent game to get a 0-to-100 grade on the quality of his performance. Of course, Darnold did not take the field in the Jets’ Week 5 game against Arizona, so this time, we will be looking at Joe Flacco.
Sam Darnold Grades
Week 2 vs. San Francisco 49ers
Nania’s Darnold Grades home page (links to all 2019-20 games)
Grades Explained
Digging through the All-22 film, I went back and graded every play (pass attempt, sack, rushing attempt) Flacco logged in the game, scoring each on a scale of 0-to-10 (5 representing an average play).
Anything and everything is taken into account. Ball placement. Accuracy. Should-be turnovers. Unlucky turnovers. Protection. Play-calling effectiveness. Impact of the route-running and ball tracking quality by the intended receiver. Down and distance. Field position. Game situation.
Every layer of decision-making is considered. Did Flacco choose the best available option? Did he scan the field to check all possible options? Did he take an over-aggressive shot when a first down was available underneath? Did he check down too early and leave a potential big play on the field? Should he have run? Did he take a sack he should not have? Should he have thrown the ball away?
Simple statistics do not account for any of those factors. Using a manual, play-by-play grading system, many crucial variables that usually go overlooked are being properly valued. Sprinkle in this essential context, and we get a grade that is much more representative of the quarterback’s true performance level than standard box score numbers.
Flacco’s final scores are scaled from 0-to-100, with 50 representing the approximate league average (based on the analysis of other quarterbacks).
Glossary
Here is a glossary of my personally-tracked statistics, as well as some context to help you understand what good and bad numbers look like.
Overall grade: 0-to-100 grade based on the average score of all plays analyzed. (Average: 50, Max: 100, Minimum: 0)
Plays: Number of plays graded.
Positive plays: Number of plays graded above 5.0: above-average efforts. (Average: 50%, Phenomenal: >60%, Awful: <40%)
Negative plays: Number of plays graded below 5.0: below-average efforts. (Average: 30%, Phenomenal: <20%, Awful: >40%)
Positive/negative ratio: Positive plays divided by negative plays: a measure of consistency. (Average: 1.80, Phenomenal: 3.00+, Awful: <1.00)
Average positive: The average score of all positive plays (scored above 5). An indicator of how high the quarterback’s peaks were — a higher score indicates a great rate of splash plays, a lower score indicates some combination of a low number of big-time plays, many easy throws created by the supporting cast, or teammates bailing out the quarterback on subpar throws. (Average: 5.90, Phenomenal: 6.00+, Awful: <5.80)
Average negative: The average score of all negative plays (scored below 5). An indicator of how low the quarterback’s valleys were — a higher score indicates few catastrophic mistakes and/or lost plays tending to be more the supporting cast’s fault than the quarterback’s, while a lower score indicates that the quarterback’s mistakes were generally very bad and that lost plays tended to be largely his own fault. (Average: 3.80, Phenomenal: 4.00+, Awful: <3.60)
Wow Factor: Combination of average positive and average negative. An indicator of the ability to both avoid big mistakes and produce impressive moments. (Average: 9.70, Phenomenal: 10.00+, Awful: <9.40)
7+ plays: Number of plays graded 7 or better: elite moments. (Average: 8%, Phenomenal: >12%, Awful: <4%)
≤3 plays: Number of plays graded 3 or worse: brutal moments. (Average: 8%, Phenomenal: <4%, Awful: >12%)
Let’s dig in. We’ll get into my numbers on Flacco’s game against Arizona, compare my findings to his advanced metrics and box score statistics, and break down his best and worst plays on film.
To kick things off, here is my comprehensive 0-to-100 grade on Flacco’s performance against the Cardinals.