Was Breece Hall the NFL’s best RB on a per-play basis in 2022?
New York Jets rookie Breece Hall looked like one of the NFL’s best running backs when he was on the field in 2022.
Was Hall really playing like an elite running back? Or are Jets fans overrating him?
I wanted to figure out exactly what level Hall was playing at before he got hurt.
Read More Jet X Content:
Article: How does Tom Brady’s retirement affect NY Jets’ QB hunt?
Article: NY Jets take Big 10 star in latest internet consensus mock draft
Article: NY Jets target Aaron Rodgers reveals timetable for 2023 decision
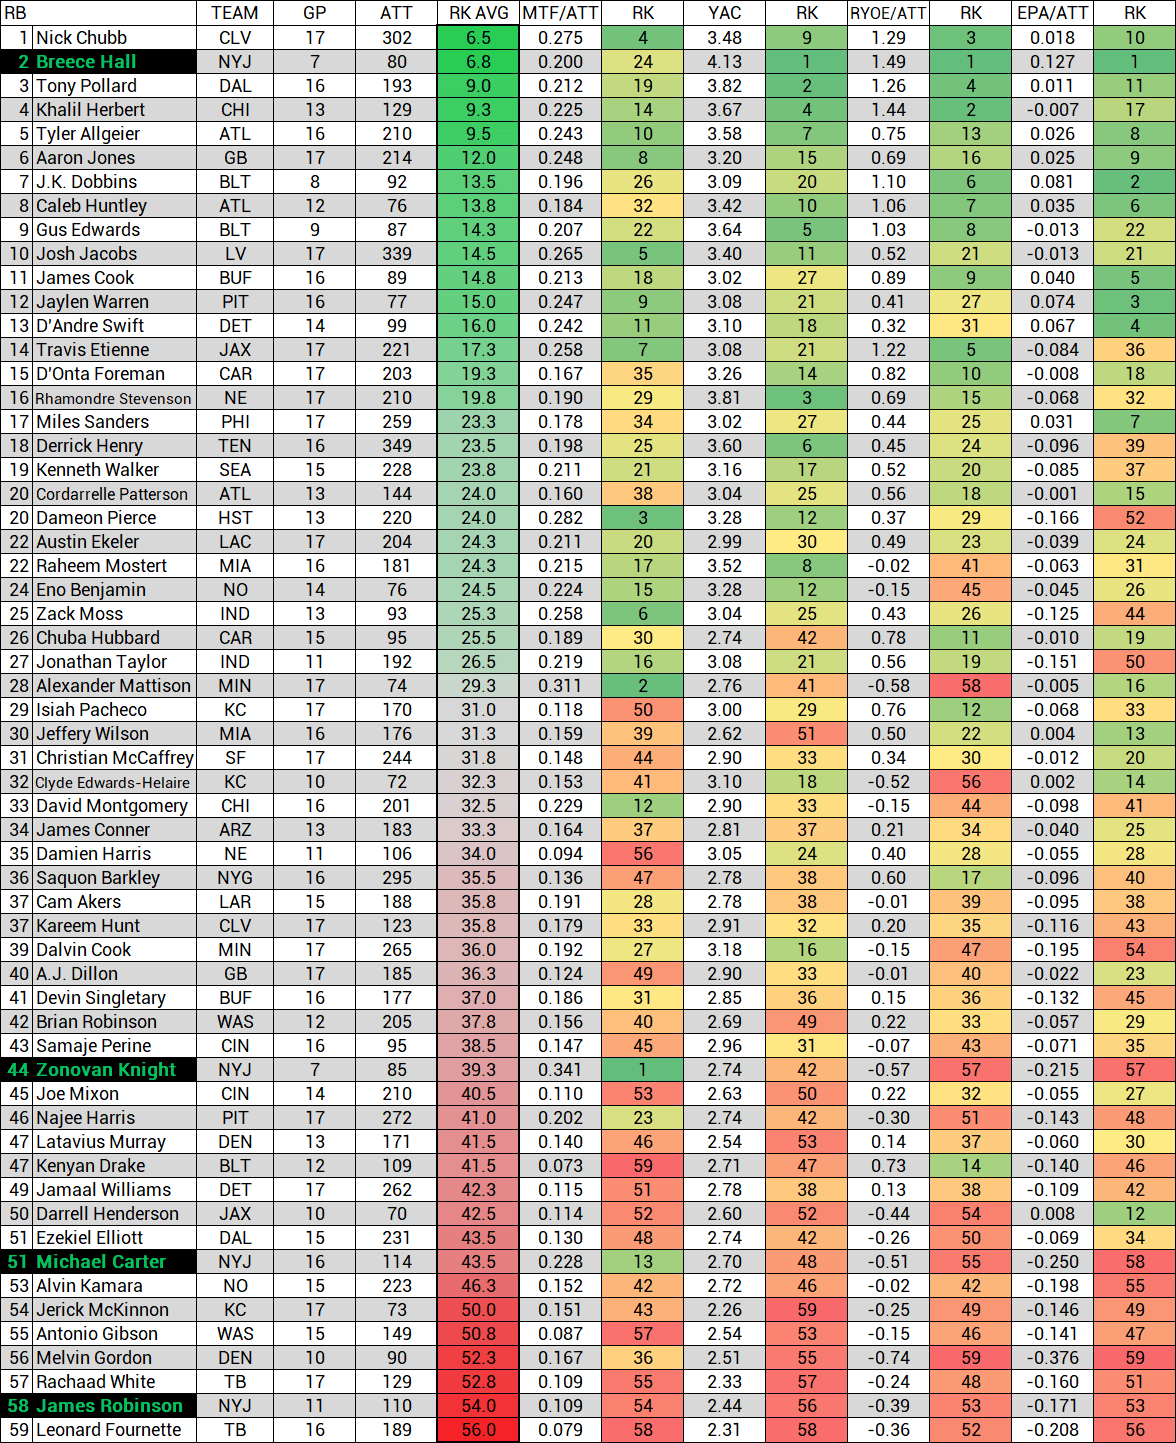
To pinpoint how well Hall was playing relative to other NFL running backs, I decided to see where Hall ranked among qualified running backs in four different rushing metrics. I then ranked all qualified running backs according to their average ranking across those four categories.
Here are the four categories I chose:
- Yards after contact per carry (Pro Football Focus)
- Missed tackles forced per carry (Pro Football Focus)
- Rushing yards over expected per carry (NFL Next Gen Stats)
- Expected points added (EPA) per carry (NFL Next Gen Stats)
All four of these metrics are efficiency-based rather than volume-based, which means they can be used to fairly compare all running backs on the same plane regardless of how many games or carries they had (although players with smaller samples can be prone to more extreme results).
Let’s dive in and see where Hall ranked in each category. We’ll also include the Jets’ other three primary running backs: Michael Carter, Zonovan Knight, and James Robinson.
Yards after contact per carry
All rankings in this article are among 59 running backs who had at least 70 carries in the 2022 regular season.
- Hall: 4.13 (1st)
- Knight: 2.74 (43rd)
- Carter: 2.70 (48th)
- Robinson: 2.44 (57th)
- Group average: 3.00
This metric is a good way to evaluate how strong a running back is at the point of contact. Does he consistently grind out extra yards after he is wrapped up? Or does he go down where he’s hit?
Hall was dominant in this area, consistently bowling over defenders for bonus yards at the end of runs. Each of the other three Jets running backs was often brought down fairly easily.
Missed tackles forced per carry
- Knight: 0.341 (1st)
- Carter: 0.228 (13th)
- Hall: 0.200 (24th)
- Robinson: 0.109 (54th)
- Group average: 0.185
This metric tells us how often a running back makes defenders miss.
Knight was a machine at forcing missed tackles. The Jets’ offensive line was at its lowest point during Knight’s span of appearances, which forced him to encounter a lot of defenders in the backfield, and he made a very high percentage of them miss. Carter also had a nice year in this category. Hall was solid in this area. Robinson looked like he couldn’t make a tree miss.
There are some flaws to this stat. For one, it is overly friendly to running backs who dance around too much. A runner can rack up a bunch of missed tackles forced by doing cute moves in the backfield when he really should have been charging forward and gaining more yards. This makes him look elusive when he is actually going nowhere.
On the other end, sometimes a running back blows by defenders with his speed rather than technically “forcing” them to miss the tackle. Speed is a form of elusiveness in itself, but since it doesn’t involve actually making defenders miss a tackle opportunity, it hurts you in this particular statistic to beat defenders with pure speed rather than squaring them and beating them with a move.
It’s also important to note that there is a wide spectrum of possibilities for what any given missed tackle could entail. It could be a runner merely jumping over a dive tackle behind the line of scrimmage just before he runs out of bounds for a loss, or it could be juking a defender in the open field to turn a 25-yard run into a 50-yard touchdown. Not all missed tackles forced are created equal. I think Carter, in particular, racked up a high number of missed tackles forced that weren’t particularly impactful.
Rushing yards over expected per carry
- Hall: 1.49 (1st)
- Robinson: -0.39 (53rd)
- Carter: -0.51 (55th)
- Knight: -0.57 (57th)
- Group average: 0.31
This metric from NFL Next Gen Stats aims to capture how many yards a runner gains beyond what he is expected to gain. It uses player tracking data to estimate the expected number of yards that should be gained on each play based on the quality of the blocking and then compares the player’s actual yardage to the expected yardage.
While I love the concept, I have suspicions about this metric’s validity. If you look at the expectations laid for specific plays, there are often some wonky conclusions that make little sense. I have seen plenty of plays where the runner is immediately stuffed in the backfield after taking the ball, but the metric still thinks the runner should have been expected to gain 5+ yards. This is a natural flaw in how the metric is tracked. Gauging the blocking quality on a given play based solely on tracking data – without actually watching the play with the human eye – is bound to result in some miscalculations. It feels like this is a great idea that still needs better execution.
Despite the questionable play-by-play conclusions, it seems fair to assume this metric should even out over a large sample of plays and paint a somewhat accurate picture, so I figured I would include it anyway. No metric is perfect, and besides, with this particular study, I wanted to include as many metrics as possible to create a strong and wide-ranging cumulative ranking.
Hall soared beyond expectations. The quality of his blocking was hardly different than the quality of the blocking received by his teammates, but he simply did a much better job of outperforming his offensive line.
Robinson, Carter, and Knight fell significantly below what NGS expected them to gain. I think this is accurate for Robinson and Carter, but I would contend that Knight got a raw deal in this stat. I saw some plays on film where the expectation metrics were harsh on Knight for some poorly-blocked plays. Personally, I’d claim Knight should be closer to league-average in this metric, but the data is the data. Take it for what it’s worth.
EPA per carry
- Hall: 0.13 (1st)
- Robinson: -0.17 (53rd)
- Knight: -0.22 (57th)
- Carter: -0.25 (58th)
- Group average: -0.07
This metric is designed to capture overall rushing production in terms of Expected Points Added, a measure of success that defines the value of each play by the effect it has on the offense’s likelihood to score. It’s not designed to isolate the running back from the blocking like the other three metrics are. With this in mind, it’s important to note that this metric is influenced evenly by the running back and his blocking.
I figured it would be a nice balance to have the majority of the metrics in this study be designed for evaluating running backs individually, but to have one that simply looks at overall production.
Hall was the most productive running back in the league when it comes to EPA per carry. Handing the ball to Hall yielded otherworldly results for the Jets. Each of the other three Jets running backs produced brutal results when handed the football.
Final results
Here is a look at the top 10 running backs of the 2022 season based on their average ranking across these four categories:
- Nick Chubb, Browns: Average ranking of 6.5
- Breece Hall, Jets: 6.8
- Tony Pollard, Cowboys: 9.0
- Khalil Herbert, Bears: 9.3
- Tyler Allgeier, Falcons: 9.5
- Aaron Jones, Packers: 12.0
- J.K. Dobbins, Ravens: 13.5
- Caleb Huntley, Falcons: 13.8
- Gus Edwards, Ravens: 14.3
- Josh Jacobs, Raiders: 14.5
Breece Hall placed second behind only the great Nick Chubb. It appears Hall truly was playing like one of the absolute best running backs in the league.
If a running back ranks highly in only one or two rushing categories, it could be misleading, as every metric has a different set of flaws and limitations. But if he ranks highly in every category, as Hall did (including being No. 1 in three of the four categories we looked at), then it’s impossible to dispute that he’s a great player.
We’ll never know if Hall would have maintained the same level of performance over the next 10 games of his rookie season, but it doesn’t take away from just how unstoppable he looked on a per-play basis over his first seven games.
Here is the full leaderboard: